
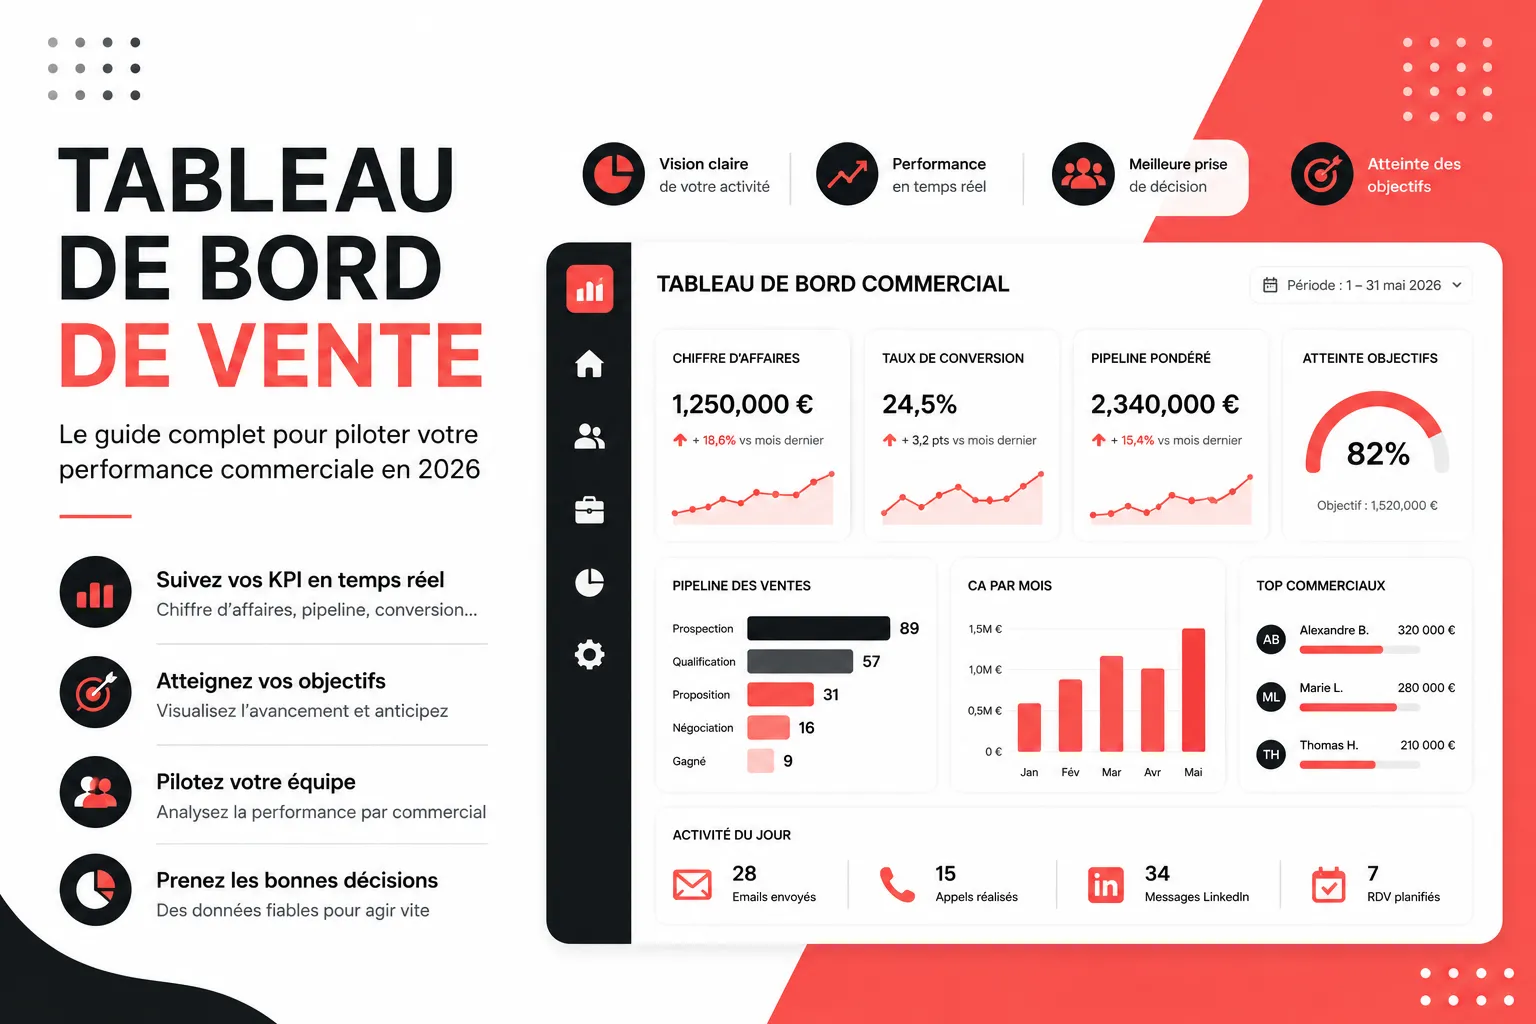
Poorly designed dashboards mean sales teams flying blind: figures scattered between Excel, the CRM, and reports sent by email, no real-time view, and decisions made too late.
Conversely, good sales dashboards give every salesperson, every sales manager, and every sales director a clear view of sales performance, minute by minute.
In this guide, you will discover what sales dashboards are, why they have become essential for any sales team, which key performance indicators (KPIs) to include, how to build dashboards step by step, and which tools to use to create dashboards – from Excel to modern CRMs like Centra. We will also look at several dashboard examples and how to use a dashboard daily for decision-making.
What is a sales dashboard?
A sales dashboard is a visual tool that centralizes key performance indicators related to a company's sales activity: revenue, conversion rate, sales pipeline, sales targets, sales performance by salesperson or by team. It is a management and data analysis tool for the entire sales team.Unlike a static sales report sent at the end of the week, sales dashboards update in real time.
They allow each salesperson to track target achievement, and each sales manager to make quick decisions based on reliable sales data rather than gut feelings. It's a true decision-support and data communication tool between the field and management. Dashboards are not limited to sales: marketing, customer relationship management (CRM), and finance also use their own dashboards. Three main types of sales dashboards are generally distinguished:
Strategic dashboard: intended for management, it presents overall sales performance, sales growth, and trends over several months.
Operational dashboard: used daily by salespeople and their sales manager to track the sales pipeline, current tasks, and next actions.
Analytical dashboard: designed to explore sales data in depth, identify trends, and understand the causes of a decline or increase in sales volume.
KPIs to include in your sales dashboards
The quality of your sales dashboards depends above all on the key performance indicators chosen. Here are the most commonly used KPIs by high-performing sales teams to build actionable dashboards.
Outcome indicators
Revenue generated (by period, by salesperson, by team)
Conversion rate at each stage of the sales pipeline
Average basket size per client or per signed contract
Sales target achievement rate
Activity indicators (sales pipeline)
Number of leads generated
Number of opportunities created in the sales pipeline
Number of calls, emails, and messages sent
Response rate by prospecting channel
Forecast indicators
Sales forecasts for the current quarter
Weighted value of the sales pipeline
Speed of opportunity progression through the sales pipeline
A good sales dashboard does not try to display every possible indicator: it focuses on the KPIs that are truly actionable for the sales team and the current sales objectives.
How to create an effective sales dashboard?
Here is the method for designing and building relevant sales dashboards, step by step, whether you start with Excel or a CRM.
1. Define the sales objectives to track
Before choosing a tool or dashboard type, clarify what you want to measure: sales growth, target achievement, individual salesperson performance, or sales pipeline management. A sales dashboard must answer a specific business question.
2. Choose the right key indicators
Select a limited number of sales KPIs directly linked to your sales objectives. A readable dashboard prioritizes clarity over exhaustiveness.
3. Centralize a reliable data source
This is the most critical step. A sales dashboard is only valuable if the sales data feeding it is accurate and up to date. This is why most sales teams connect their dashboard directly to their CRM rather than relying on manual Excel files.
4. Choose the right visualization format
Trend charts for revenue, gauges for target achievement, funnel charts for the sales pipeline: each indicator deserves the most readable format.
5. Automate the update
An effective sales dashboard updates in real time, without manual intervention. This is what distinguishes a true management tool from a static Excel export.
6. Share the dashboard with the entire team
A sales dashboard only has impact if it is actually consulted. Make it accessible to every salesperson, every sales manager, and every sales director, with a view adapted to their level of responsibility.
Creating dashboards with Excel or a CRM
This is the question most sales teams ask when setting up sales dashboards: should you build a standalone dashboard in Excel, or use a management dashboard integrated into a CRM?
Excel remains an accessible option to start and create simple dashboards: free, flexible, familiar. But its limits quickly appear as the sales team grows: manual updates, error risks, lack of real-time data, impossibility of automatically tracking the sales pipeline, sales volume, or multi-channel prospecting activities.
Using an Excel dashboard for a single person may suffice; beyond that, it quickly becomes a bottleneck.A CRM with an integrated sales dashboard solves these customer relationship management and tracking problems: sales data is centralized in a single data source, every sales action (email, call, Linkedin message, created opportunity) automatically feeds the indicators, and sales reporting is generated effortlessly.
This is the main advantage of management dashboards natively integrated into a CRM compared to a manually built summary dashboard.This is exactly the role Centra plays for sales teams in outbound prospecting. Rather than juggling between a CRM, a Linkedin prospecting tool, a contact enrichment software, and a spreadsheet for reporting, Centra centralizes everything in a single tool:
It allows you to build prospect lists and automatically enrich contacts (email, phone) directly from Linkedin.
It enables you to run multi-channel campaigns (email, invitations, Linkedin messages), with real-time tracking of response and conversion rates.
It centralizes the entire sales pipeline, contacts, companies, and each salesperson's tasks in a view shared by the entire sales team.
Centra's sales dashboards automatically aggregate this data: number of leads generated, conversion rate by channel, sales pipeline progress, mobilized sales force, individual performance of each salesperson. For an agency managing multiple client accounts or a growing sales department, this means reliable sales reporting, no manual re-entry, and much faster decision-making. Sales managers thus gain a true data analysis and management tool, rather than a static Excel sheet.
Examples of sales dashboards according to your needs
Sales dashboard for a sales management team
Synthesized view of revenue, sales growth over the period, team target achievement rate, and sales forecasts for the quarter. This type of performance dashboard is primarily used for decision-support at the management level.
Prospecting dashboard for an outbound team
Tracking of lead volume generated, response rate by channel (email, Linkedin), number of meetings booked, and conversion rate into opportunities. This is the type of dashboard that multi-channel prospecting teams, such as those using Centra, consult daily to adjust their campaigns and continuously monitor sales.
Pipeline dashboard for a sales manager
Distribution of opportunities by sales pipeline stage, weighted value, at-risk opportunities, and each salesperson's performance against their individual target. This pipeline dashboard is one of the most consulted daily by sales managers.
Individual performance dashboard
Each salesperson can track their own indicators in this type of dashboard: number of actions performed, personal conversion rate, achievement of their monthly target. This type of dashboard promotes autonomy and accountability, and usefully complements the collective dashboards intended for sales managers.
The qualities of a good sales dashboard
A good dashboard must combine several essential qualities. These are the criteria that distinguish truly useful dashboards from decorative dashboards that no one consults:
Readable: a readable dashboard displays key indicators at a glance, without information overload – dashboard ergonomics make the difference.
Reliable: sales data comes from a single data source, updated in real time.
Actionable: each indicator must bring real added value and enable a concrete decision to be made, not just illustrate a number.
Adapted to its audience: a sales director, a sales manager, and a field salesperson do not need the same view of the same dashboards.
Accessible: easily consultable by the entire sales team and sales department, without technical manipulation.
Using a dashboard that ticks these five criteria ensures that sales dashboards become a daily reflex rather than a tool consulted once a month.
In summary
A sales dashboard is not just a prettification of your data: it is the tool that enables a sales team to manage its daily sales performance, achieve its sales objectives more quickly, and make decisions based on reliable sales data rather than impressions. Whether you start with an Excel sheet or directly connect your CRM like Centra, the key is to choose actionable key indicators, a centralized data source, and a format accessible to the entire sales team.
Frequently Asked Questions
How to create a sales dashboard?
Define your sales objectives, select a limited number of key indicators, centralize a reliable data source (ideally your CRM), choose a visualization format adapted to each indicator, then automate the update and share the dashboard with the entire sales team.
Which sales indicators should be prioritized?
Revenue, conversion rate, sales target achievement, sales pipeline volume, and sales forecasts are the key indicators most tracked by sales teams.
What are the three types of dashboards?
We generally distinguish the strategic dashboard (intended for management), the operational dashboard (daily use), and the analytical dashboard (in-depth exploration of sales data).
What is the difference between a sales dashboard and a sales report?
A sales report is a one-off document, often sent by email at the end of a period. A sales dashboard, on the other hand, is a living tool, updated in real time, accessible at any time by the sales team.
Excel or CRM: which to choose for your sales dashboard?
Excel is suitable for getting started with a low volume of data, but quickly becomes limited (manual updates, lack of real-time data). A CRM like Centra automates sales data collection and indicator calculation, making it more suitable as the sales team grows.